
Download Traffic Monitor for Windows
Track network speed, CPU load, and memory usage right on your desktop. A small floating window or taskbar widget that keeps your system stats always visible.
What Is Traffic Monitor?
A lightweight, open-source Windows utility that puts real-time network speed, CPU load, and memory stats right on your desktop.
Real-Time System Stats at a Glance
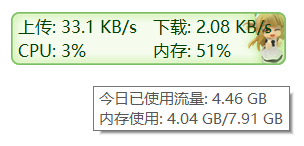
Traffic Monitor is a free, open-source desktop tool for Windows that shows live network upload and download speeds alongside CPU and RAM usage. Built by developer zhongyang219 and hosted on GitHub with over 35,000 stars, it has become one of the most popular system monitoring tools in the Windows community. The app weighs in at just 1.31 MB and runs quietly in the background without eating up resources.
You can use Traffic Monitor two ways. The first is a small floating window that sits on top of other applications, giving you a constant readout of your connection speeds and hardware load. The second is a compact taskbar widget that tucks neatly into the Windows notification area. Both modes update in real time, so you always know what your machine is doing.
Who Is It For?
If you have ever wondered whether your internet connection is actually delivering the speeds your ISP promised, or if a background process is quietly hogging your CPU, Traffic Monitor answers those questions at a glance. Power users, gamers, streamers, and IT professionals rely on it to keep tabs on system performance without opening Task Manager every five minutes. Home users find it handy for spotting bandwidth-hungry apps or confirming that a large download is still running.
Open Source and Community-Driven
Released under the GPL-3.0 license, Traffic Monitor is completely free with no ads, no upsells, and no data collection. The source code is public, which means anyone can audit it for security or contribute new features. The project receives regular updates — version 1.85.1, released in February 2025, fixed Windows 11 taskbar compatibility and improved network speed accuracy. A dedicated Lite edition also exists for users who prefer running without administrator privileges.
Traffic Monitor supports Windows 7, 8, 8.1, 10, and 11. Beyond basic stats, the standard edition includes hardware temperature readings for your CPU, GPU, hard drive, and motherboard through integration with LibreHardwareMonitor. You can customize skins, pick your own colors and fonts for each metric, set network speed alerts, and even track daily or weekly traffic history.
Ready to try it? Download Traffic Monitor or jump to Getting Started to set it up in minutes.
System Requirements
Traffic Monitor is built to be lightweight. It runs comfortably on most Windows machines without slowing anything down.
| Component | Minimum | Recommended |
|---|---|---|
| Operating System | Windows 7 SP1 (64-bit) | Windows 10 or 11 (64-bit) |
| Processor | 1 GHz single-core | 2.4 GHz dual-core or faster |
| RAM | 2 GB | 4 GB or more |
| Disk Space | 200 MB available | 500 MB available |
| Display | 1024 x 768 | 1920 x 1080 or higher |
| Network | Any active network adapter | Ethernet or Wi-Fi adapter |
| Permissions | Standard user (Lite version) | Admin rights (full hardware monitoring) |
Ready to get started? Download Traffic Monitor – it takes under a minute to set up.
Key Features
Traffic Monitor packs system monitoring tools into a tiny footprint. Here is what you get out of the box.
Real-Time Network Speed Display
Watch your upload and download speeds update every second in a compact floating window. Traffic Monitor reads directly from your active network adapter, so the numbers match what your connection is actually doing — not what a speed test says it could do.
CPU & RAM Monitoring
Keep an eye on processor load and memory usage without opening Task Manager. The display updates live, making it easy to spot resource-hungry processes at a glance.
Taskbar Integration
Embed your stats directly into the Windows taskbar. The two-line compact widget blends into your notification area, showing network speed, CPU, and RAM without using any extra screen space.
Draggable Floating Window
The floating overlay sits on top of other windows and can be dragged anywhere on your desktop. It has a semi-transparent background that stays readable over any wallpaper or application.
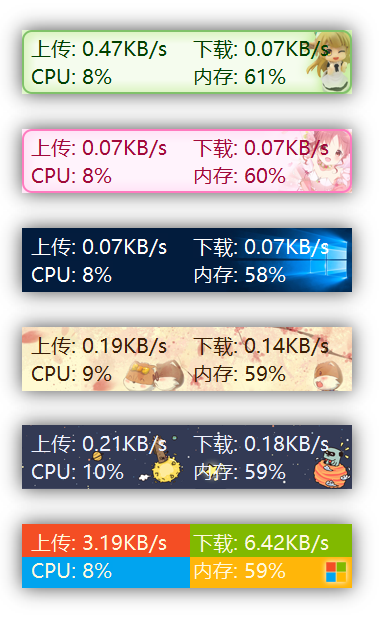
Customizable Skins with PNG Support
Swap between pre-built skins or create your own using PNG images with transparency. You can customize fonts, colors, and unit labels for each individual metric. Traffic Monitor also switches skins automatically when Windows toggles between light and dark mode.
Hardware Temperature Readouts
Monitor CPU, GPU, hard drive, and motherboard temperatures through the LibreHardwareMonitor integration. Requires the standard (non-Lite) version with admin privileges.
Traffic History & Statistics
Track your bandwidth usage over days and weeks. Handy if you are on a metered connection or just want to see which days your network gets the most traffic.
Auto Network Adapter Selection
Switches between Wi-Fi, Ethernet, or VPN adapters automatically. You can also pick a specific adapter manually if your setup needs it.
Plugin Support
Extend what Traffic Monitor can display through third-party plugins. Developers can add custom data sources and metrics that show up alongside the built-in readouts.
Network Speed Alerts
Set thresholds for upload or download speed and get notified when your connection drops below or spikes above your target values.
Ultra-Lightweight (1.3 MB)
The entire application weighs around 1.3 MB. It uses minimal CPU and RAM itself, so monitoring your system never slows it down. A Lite version runs without admin rights for locked-down environments.
CPU Frequency Display
See your processor’s current clock speed alongside usage percentage. Useful for checking whether your CPU is boosting properly under load or throttling due to heat.
Traffic Monitor is free, open-source, and backed by 35,000+ stars on GitHub.
Download it now and start monitoring in seconds.
Download Traffic Monitor
Get the latest stable release of Traffic Monitor. Pick the version that fits your setup – standard for full hardware stats, or lite if you prefer running without admin rights.
Traffic Monitor is a portable application – no installer required. Extract the ZIP file to any folder and run TrafficMonitor.exe directly. All downloads are pulled from the official GitHub releases page. The standard version includes hardware temperature monitoring through LibreHardwareMonitor and requires administrator privileges. The lite version skips hardware monitoring but runs without elevated permissions, making it a good pick for shared or locked-down machines.
Screenshots
See Traffic Monitor in action – from the floating desktop overlay to taskbar integration and customizable skins.

Getting Started with Traffic Monitor
From download to a fully customized system monitor on your desktop in under five minutes. Here is everything you need to know.
Downloading Traffic Monitor
Head to our download section above to grab the latest release of Traffic Monitor. The current version is 1.85.1, and the ZIP archive is only about 1.31 MB — small enough to download in seconds on any connection.
You will see two editions available for download. The Standard edition gives you the full feature set, including hardware temperature monitoring for your CPU, GPU, hard drives, and motherboard. It requires administrator privileges when you launch it. The Lite edition skips hardware monitoring but runs without needing admin rights, which makes it a better fit if you are on a restricted work computer or simply do not need temperature readings.
Both editions come in x64 (64-bit) and x86 (32-bit) variants. If you are running Windows 10 or 11 on a modern PC, go with the x64 build. Pick x86 only if your system is still on a 32-bit version of Windows.
Traffic Monitor is a portable application. There is no .exe installer or .msi package. You download a ZIP file, extract it, and run the program directly. No registry entries, no system file changes, no uninstaller needed.
Installation Walkthrough
Because Traffic Monitor is portable, “installation” really just means extracting a ZIP file. There is no installer wizard, no license agreement screen, and no checkboxes to worry about.
- Extract the ZIP archive. Right-click the downloaded file (for example,
TrafficMonitor_V1.85.1_x64.zip) and select Extract All. Choose a permanent location such asC:ToolsTrafficMonitororD:AppsTrafficMonitor. Avoid extracting to your Downloads folder since you might accidentally delete it later. - Open the extracted folder. Inside you will find
TrafficMonitor.exealong with a few supporting files likeconfig.ini, askinsfolder, and apluginsfolder. - Run TrafficMonitor.exe. Double-click the executable. If you chose the Standard edition, Windows will ask for administrator permission — click Yes to continue. The Lite edition launches without any prompt.
- Handle the Windows SmartScreen warning. Since Traffic Monitor is not signed with a commercial code certificate, Windows SmartScreen may show a blue warning that says “Windows protected your PC.” Click More info, then click Run anyway. This is normal for open-source software distributed through GitHub.
After launch, a small floating window appears on your desktop showing upload speed, download speed, CPU usage, and memory usage. That is it — Traffic Monitor is running.
To make Traffic Monitor launch automatically when Windows starts, right-click the floating window and check Auto Run from the context menu. You can also create a shortcut to TrafficMonitor.exe and place it in your Windows Startup folder (shell:startup in the Run dialog) for the same effect.
If you want to enable portable mode so all settings are stored in the application folder rather than in your user profile, open the file global_cfg.ini in the application folder and set:
portable_mode = true
Initial Setup and Configuration
There is no first-run wizard. Traffic Monitor starts working the moment you open it. But a few quick adjustments will make the experience much better.
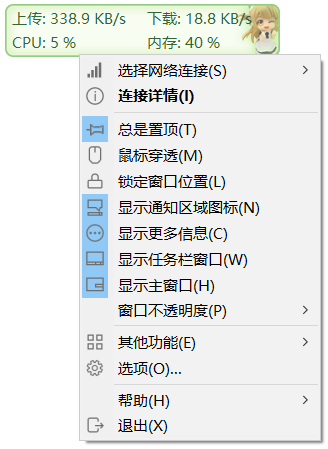
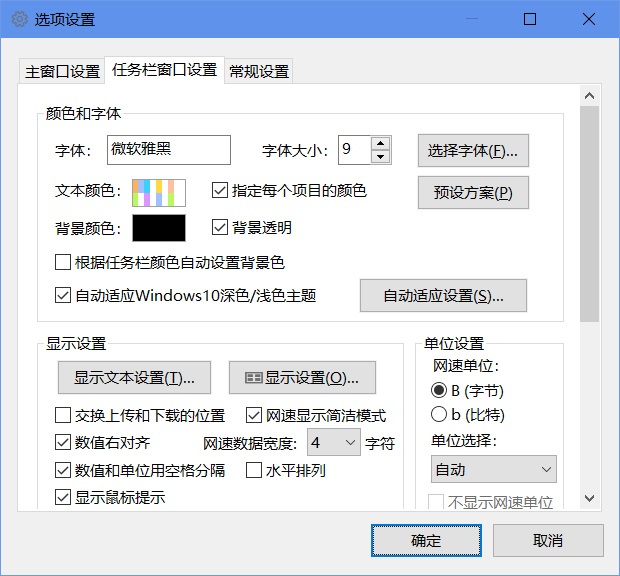
Open the Options dialog. Right-click the floating window on your desktop and select Options… from the context menu. The settings window has several tabs across the top.
- General tab: Set Language to English (or your preferred language). Enable Check for updates on startup so you always know when a new version drops. Set Update source to GitHub if you are outside China.
- Main Window tab: Customize what the floating window displays. Toggle individual items like upload speed, download speed, CPU %, memory %, CPU temperature, and GPU temperature on or off. Adjust the font, font size, and color for each item individually. Set Network speed unit to auto (switches between KB/s and MB/s based on speed) or fixed to your preference.
- Taskbar Window tab: Turn this on to embed a compact stats display directly in your Windows taskbar. Pick which metrics to show, choose between a horizontal or vertical layout, and configure the text alignment and colors to blend with your taskbar theme.
Select the right network adapter. Right-click the floating window and go to Select Network Connections. Traffic Monitor auto-detects active connections, but if you have multiple network adapters (Wi-Fi, Ethernet, VPN), pick the specific one you want to track. Selecting “Auto” works well for most people.
If you are using the Standard edition and want temperature readings, go to Options > General and check Enable hardware monitoring. This uses the LibreHardwareMonitor library under the hood. After enabling it, you will see CPU, GPU, disk, and motherboard temperature options in both the floating window and taskbar window settings.
Your First Monitoring Setup
With Traffic Monitor running, let us walk through setting up a practical monitoring layout. The goal: keep upload speed, download speed, CPU load, and RAM usage visible at all times without cluttering your screen.
Step A: Position the floating window. Click and drag the floating window to a corner of your screen. Many users park it in the top-right corner, just below the taskbar. The window stays on top of other applications by default. If you prefer it behind other windows, right-click and uncheck Always on Top.
Step B: Enable mouse penetration. Right-click the floating window and check Lock Window Position. Then enable Mouse Penetration from the same menu. This makes clicks pass through the floating window so it never gets in your way when you are working. The window becomes purely visual — you can still right-click to access the menu.
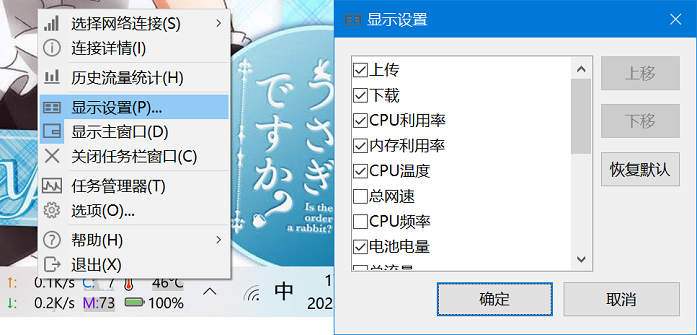
Step C: Set up the taskbar display. Right-click the floating window, go to Show Taskbar Window. A compact two-line display appears in your taskbar notification area. Right-click the taskbar display and select Display Settings to choose which items appear. A common setup: line one shows upload and download speed, line two shows CPU and memory percentage.
Step D: Apply a skin. Right-click the floating window and navigate to Other Functions > Change Skin. Traffic Monitor ships with several built-in skins. The default is a semi-transparent dark overlay. There are light skins, minimal skins, and colorful skins available. You can also download community skins from the GitHub repository and drop them into the skins folder.
| Action | How To |
|---|---|
| Open settings | Right-click floating window > Options… |
| Toggle taskbar display | Right-click > Show Taskbar Window |
| Lock window position | Right-click > Lock Window Position |
| Enable mouse pass-through | Right-click > Mouse Penetration |
| Switch network adapter | Right-click > Select Network Connections |
| Change skin | Right-click > Other Functions > Change Skin |
| View traffic history | Right-click > Other Functions > Traffic Statistics |
| Auto-start on boot | Right-click > Auto Run |
Tips, Tricks, and Best Practices
Keep resource usage minimal. Traffic Monitor typically uses under 5 MB of RAM and negligible CPU. If you notice higher usage, disable hardware monitoring in the Standard edition, since the temperature polling adds a small overhead. The Lite edition is the lightest option available.
Auto light/dark skin switching. Traffic Monitor can automatically swap between a light and dark skin based on your Windows theme. Set this up in Options > Main Window > Auto adapt to Windows 10 dark theme. You will need to assign one skin for light mode and one for dark mode.
Custom display items. Beyond the basics, you can show CPU frequency, disk read/write speed, and GPU usage in both the floating window and the taskbar display. Dig into the Display Settings for each window type to find these options under the item checkboxes.
Network speed alerts. Set a notification threshold in Options > General > Notification Settings. Traffic Monitor can alert you when your upload or download speed crosses a specific value, or when memory usage gets too high.
Plugin support. Starting with version 1.82, Traffic Monitor supports plugins that extend its functionality. Place plugin DLL files in the plugins folder inside your Traffic Monitor directory and restart the application.
Where to get help: The official GitHub repository has a detailed English README, a wiki with option explanations, and an active issues section. Reddit communities like r/Windows and r/software frequently discuss Traffic Monitor tips. For updates, enable the startup update check in Options or watch the GitHub releases page.
Ready to start monitoring? Download Traffic Monitor and have your system stats visible in under a minute.
Frequently Asked Questions
Answers to the most common questions about downloading, installing, and using Traffic Monitor on Windows.
Is Traffic Monitor safe to download and use?
Yes, Traffic Monitor is safe to download and use. The application is open-source software published under the GPL-3.0 license, which means its entire source code is publicly available for anyone to inspect on GitHub. The project has earned over 35,000 stars from the developer community, making it one of the most trusted system monitoring tools on the platform.
Traffic Monitor version 1.85.1, released on February 10, 2025, weighs just 1.31 MB as a ZIP download. The small file size itself is a strong indicator that the package contains no bundled adware or bloatware. The application does not require an internet connection to function, does not collect telemetry data, and does not phone home to any server. Every release is built directly from the public source code on GitHub by the original developer, zhongyang219.
- Download only from the official GitHub releases page or from trusted sources like our download section
- Avoid third-party mirror sites that may bundle unwanted software with the installer
- The standard version uses a driver called WinRing0 for hardware temperature readings, which some antivirus programs may flag as a false positive
- If you prefer to avoid the driver entirely, use the Lite version, which skips hardware monitoring and does not need administrator privileges
Pro tip: If Windows Defender flags Traffic Monitor, add the extraction folder to your exclusion list. The WinRing0 driver is also used by popular tools like HWiNFO and Open Hardware Monitor, and the detection is a known false positive.
For more details on what Traffic Monitor can do, check our features overview.
Why does Windows Defender flag Traffic Monitor as a virus?
Windows Defender sometimes flags Traffic Monitor as “VulnerableDriver:WinNT/Wnring0.G” because the standard version includes the WinRing0 driver for reading hardware sensor data like CPU temperatures and GPU usage. This is a false positive, not an actual virus or malware detection.
The WinRing0 driver is a widely used open-source kernel-level driver that dozens of reputable applications rely on, including HWiNFO, Open Hardware Monitor, and LibreHardwareMonitor. Microsoft flags it because the driver has known vulnerabilities that could theoretically be exploited by other software, not because Traffic Monitor itself is malicious. The flag started appearing more frequently after Microsoft updated its driver blocklist policies in late 2023 and early 2024.
- Open Windows Security and go to Virus & threat protection > Protection history
- Find the Traffic Monitor detection and select “Allow on device”
- Alternatively, go to Virus & threat protection settings > Exclusions > Add an exclusion
- Add the folder where you extracted Traffic Monitor (for example,
C:AppsTrafficMonitor) - If you do not want to whitelist the driver at all, download the Lite version instead, which does not include WinRing0 and will not trigger any detection
Pro tip: The Lite version of Traffic Monitor provides all core features (network speed, CPU usage, RAM usage) without requiring admin rights or the WinRing0 driver. You only lose hardware temperature monitoring.
See our download section for links to both the standard and Lite versions.
Where can I find the official safe download for Traffic Monitor?
The official and safest source for Traffic Monitor is the GitHub releases page maintained by the original developer, zhongyang219. You can also download it directly from our download section, which links to the same official release files.
The official GitHub repository at github.com/zhongyang219/TrafficMonitor hosts all release builds, including both the standard version (with hardware monitoring) and the Lite version (without admin requirements). Each release includes SHA-256 checksums so you can verify file integrity after downloading. The current version is 1.85.1, released February 10, 2025, and the ZIP file is approximately 1.31 MB.
- Official source: GitHub releases page by zhongyang219
- Secondary mirror: SourceForge (maintained by the same developer)
- Also listed on PortableApps.com as a verified portable application
- Avoid downloading from random software aggregator websites that may bundle adware or outdated versions
Pro tip: Bookmark the GitHub releases page and check it every few months for updates. Traffic Monitor does not include a built-in auto-update feature, so you need to manually download new versions when they are released.
Head to our download section for direct links to the latest official release.
Does Traffic Monitor work on Windows 11?
Yes, Traffic Monitor works on Windows 11, though the taskbar embedding feature may require some configuration adjustments depending on your Windows 11 build version. The floating desktop window works without issues on all Windows 11 versions.
Version 1.85.1 specifically addressed several Windows 11 taskbar compatibility problems. The developer fixed issues with the taskbar window overlapping system tray icons and the Widgets button. On Windows 11 22H2 and 23H2, some users reported the taskbar display appearing in the wrong position or disappearing entirely. These issues were resolved in the newer builds. If you are running Windows 11 24H2, the floating window mode is fully functional, and taskbar mode works for most users after enabling “Avoid overlapping with right Widgets” in the settings.
- Download version 1.85.1 or later from the download section
- Extract and run Traffic Monitor – the floating window should appear immediately
- Right-click the floating window and select “Show taskbar window” to embed it in your taskbar
- If the taskbar text appears misaligned, open Options > Taskbar Window Settings and enable “Avoid overlapping with right Widgets”
- On centered taskbars, switch to left-aligned taskbar layout for best results with Traffic Monitor
Pro tip: If the taskbar display disappears after a Windows 11 update, close Traffic Monitor completely from the system tray, delete the config.ini file in the program folder, and restart the application. This forces a fresh configuration that adapts to the new taskbar layout.
Check our system requirements for full compatibility details.
What are the minimum system requirements for Traffic Monitor?
Traffic Monitor has very low system requirements and runs comfortably on almost any Windows PC made in the last 15 years. The application itself uses less than 10 MB of RAM and nearly zero CPU during normal operation.
The minimum requirements are a 1 GHz processor, 2 GB of RAM, and 200 MB of available disk space. The recommended setup is a 2.4 GHz or faster processor with 4 GB of RAM, which allows smooth hardware temperature monitoring through the LibreHardwareMonitor library. The application runs on Windows 7, Windows 8, Windows 8.1, Windows 10, and Windows 11. Both 32-bit and 64-bit versions of these operating systems are supported, with separate downloads available for each architecture.
- CPU: 1 GHz minimum, 2.4 GHz recommended
- RAM: 2 GB minimum, 4 GB recommended
- Disk space: 200 MB available
- OS: Windows 7 SP1 or later (32-bit or 64-bit)
- Runtime: Visual C++ Redistributable 2015-2022 (included in most Windows 10/11 installations)
- Admin rights: Required for standard version; not needed for Lite version
Pro tip: If you are using an older machine with limited RAM, choose the Lite version. It skips hardware sensor monitoring and runs with a memory footprint under 5 MB, making it one of the lightest system monitors available for Windows.
Visit our system requirements section for a detailed comparison table.
Does Traffic Monitor work on macOS or Linux?
No, Traffic Monitor is a Windows-only application. It does not have native macOS or Linux versions. The software relies on Windows-specific APIs for taskbar embedding, system tray integration, and hardware sensor access, which makes cross-platform support impractical without a complete rewrite.
Traffic Monitor uses the Windows GDI+ rendering system for its floating window and hooks directly into the Windows taskbar shell for its embedded display mode. These are deeply Windows-specific features. The hardware monitoring component depends on WinRing0 and LibreHardwareMonitor, both of which are Windows-only libraries. Running Traffic Monitor through Wine on Linux has been attempted by some users but produces unreliable results, particularly for the taskbar integration feature.
- macOS alternatives: iStat Menus (paid, full-featured), Stats (free, open-source menu bar monitor), MenuMeters (free, lightweight)
- Linux alternatives: Conky (highly customizable desktop monitor), Netdata (web-based real-time monitoring), i3status/Polybar (for tiling window manager users)
- Cross-platform: htop (terminal-based, macOS and Linux), btop++ (modern terminal monitor for all platforms)
Pro tip: If you use both Windows and Linux on the same machine, install Traffic Monitor on Windows and use Conky or Polybar on Linux. Both are lightweight and can be configured to show similar network speed and CPU/RAM stats on your desktop.
See our features section to learn what Traffic Monitor offers on Windows.
Is Traffic Monitor completely free to use?
Yes, Traffic Monitor is 100% free to download and use. There is no paid version, no premium tier, no trial period, and no feature gating. Every feature in the application is available to all users at no cost.
The software is released under the GNU General Public License version 3.0 (GPL-3.0), one of the most widely used open-source licenses. This means you can download, use, modify, and redistribute Traffic Monitor without paying anything. The developer, zhongyang219, maintains the project as a community contribution and does not monetize it through ads, subscriptions, or premium upgrades. The 1.31 MB download gives you the complete application with all features unlocked from the start.
- No registration or account creation required
- No ads, banners, or sponsored content inside the application
- No data collection or telemetry sent to remote servers
- No “pro” or “premium” upgrade prompts
- Free for personal, educational, and commercial use under GPL-3.0 terms
Pro tip: Because Traffic Monitor is GPL-3.0 licensed, companies can deploy it on all employee workstations without purchasing licenses. The only GPL requirement is that if you modify the source code and distribute your modified version, you must also release your changes under GPL-3.0.
Download it for free from our download section.
What is the difference between Traffic Monitor standard and Lite versions?
Traffic Monitor comes in two versions: the standard version with full hardware monitoring capabilities, and the Lite version that skips hardware sensors but runs without administrator privileges. Both versions are free, and the core network speed, CPU, and RAM monitoring features work identically in both.
The standard version includes the WinRing0 driver and LibreHardwareMonitor library, which allow it to read CPU temperature, GPU temperature, disk temperature, and motherboard sensor data. This version requires running as administrator or with elevated privileges. The Lite version removes all hardware sensor dependencies, which means it cannot display temperature readings, but it gains the advantage of running as a regular user without UAC prompts. The Lite version also avoids the Windows Defender false positive issue related to the WinRing0 driver.
- Standard version: Network speed + CPU + RAM + temperatures (CPU, GPU, disk, motherboard) – requires admin rights
- Lite version: Network speed + CPU + RAM only – no admin rights needed, no driver issues
- Both versions support floating window and taskbar embedding modes
- Both versions support custom skins and color themes
- File size: Standard is roughly 1.31 MB, Lite is slightly smaller at about 900 KB
Pro tip: If you only need network speed and basic CPU/RAM stats, go with the Lite version. It starts faster, never triggers antivirus warnings, and works in restricted enterprise environments where admin rights are not available.
Compare both versions on our download page.
How do I install Traffic Monitor on Windows step by step?
Traffic Monitor does not use a traditional installer. It is a portable application that you extract from a ZIP file and run directly. The entire installation process takes less than one minute.
The download is a small ZIP archive of approximately 1.31 MB. After extracting, you get a folder containing the main executable (TrafficMonitor.exe) along with configuration files and the optional WinRing0 driver (in the standard version). There is nothing to install in the traditional sense – no registry entries are created, no system files are modified, and no background services are registered. This portable design means you can run Traffic Monitor from a USB drive or move it between computers.
- Download the ZIP file from our download section (choose standard or Lite based on your needs)
- Right-click the ZIP file and select “Extract All” – choose a permanent location like
C:AppsTrafficMonitor - Open the extracted folder and double-click
TrafficMonitor.exe - If Windows SmartScreen appears, click “More info” then “Run anyway” – this happens because the app is not digitally signed with a commercial certificate
- A small floating window showing network speed and CPU/RAM stats will appear on your desktop
- Right-click the floating window to access settings, enable taskbar mode, or customize the display
Pro tip: Do not extract Traffic Monitor to the Downloads folder or Desktop. These locations can cause permission issues when saving settings. Use a dedicated folder like C:AppsTrafficMonitor or C:ToolsTrafficMonitor for the best experience.
For more detailed setup guidance, see our Getting Started guide.
How do I make Traffic Monitor start automatically with Windows?
Traffic Monitor has a built-in auto-start option, but many users find that using the Windows startup folder method is more reliable, especially on Windows 10 and Windows 11.
The built-in option is located in the right-click menu under Options > General Settings, where you can check “Auto run when Windows starts.” This creates a registry entry in HKEY_CURRENT_USERSoftwareMicrosoftWindowsCurrentVersionRun. However, this method can break if you move the Traffic Monitor folder to a different location, because the registry still points to the old path. The startup folder method is more resilient because Windows resolves shortcut targets dynamically.
- Press
Win + Rto open the Run dialog - Type
shell:startupand press Enter – this opens the Windows Startup folder - Navigate to your Traffic Monitor installation folder in a separate File Explorer window
- Right-click
TrafficMonitor.exe, select “Create shortcut” - Drag the shortcut into the Startup folder you opened in step 2
- Restart your computer to verify Traffic Monitor launches automatically
Pro tip: If Traffic Monitor stops auto-starting after a Windows update, check Task Manager > Startup tab. Windows updates sometimes disable startup entries. Make sure Traffic Monitor shows as “Enabled” in that list. If it does not appear at all, recreate the shortcut in the startup folder.
Read our Getting Started guide for additional configuration steps.
Should I use the portable version or is there an installer for Traffic Monitor?
Traffic Monitor only comes as a portable application. There is no traditional installer (MSI or EXE setup wizard). You simply extract the ZIP file and run the executable directly.
This portable-only approach is actually an advantage for most users. You do not need administrator rights just to “install” the software (though the standard version needs admin to run). There are no registry entries cluttering your system, no background services consuming resources when you are not using the app, and uninstalling is as simple as deleting the folder. The entire application footprint on disk is under 10 MB, including all configuration files, skins, and the WinRing0 driver.
- Extract to a folder with full write permissions (avoid
Program Fileson some systems) - Settings are saved to
config.iniin the same folder as the executable - You can switch to AppData storage by setting
portable_mode=falseinglobal_cfg.ini - The portable nature makes it perfect for carrying on a USB drive between machines
- PortableApps.com lists Traffic Monitor as a verified portable application
Pro tip: If you want Traffic Monitor to save its configuration in %AppData% instead of the program folder (useful for multi-user machines or restricted directories), run the app once as administrator, go to Options > General Settings, and check “Save to AppData Directory.” You can also edit global_cfg.ini and set portable_mode=false manually.
Get the portable ZIP from our download section.
Why does Traffic Monitor show 0 for network speed?
Traffic Monitor showing 0 KB/s for both upload and download speed usually means it is monitoring the wrong network adapter. This is the single most common issue new users encounter, and the fix takes about 30 seconds.
By default, Traffic Monitor uses auto-detection to select your active network adapter. On machines with multiple adapters (Wi-Fi, Ethernet, VPN, virtual adapters from Docker or VMware), the auto-detection can pick an inactive adapter. This is especially common on laptops that have both Wi-Fi and Ethernet ports, or on machines running virtualization software that creates virtual network interfaces. The network speed display updates every second by default, so if you see steady zeros, the wrong adapter is almost certainly selected.
- Right-click the Traffic Monitor floating window to open the context menu
- Hover over “Select Network Connection” to see all available adapters
- Choose your active adapter – typically “Wi-Fi” for wireless or “Ethernet” for wired connections
- If unsure which adapter is active, open Windows Settings > Network & Internet and note the name of your connected adapter
- If the issue persists, go to Options > General Settings > Advanced and uncheck “Auto select,” then manually pick the correct adapter
Pro tip: If you switch between Wi-Fi and Ethernet frequently (like docking a laptop), keep “Auto select” enabled but right-click and choose “Refresh connection list” each time you switch. This forces Traffic Monitor to re-detect the active adapter without restarting the application.
Visit our Getting Started guide for more setup tips.
How do I fix Traffic Monitor not showing on the Windows 11 taskbar?
Traffic Monitor’s taskbar embedding can break on Windows 11 due to changes Microsoft made to the taskbar shell, particularly in builds 22H2 and later. The floating window still works fine, but the taskbar display may not appear or may appear in the wrong position.
Windows 11 introduced a new taskbar architecture that is fundamentally different from Windows 10. Traffic Monitor version 1.85.1 includes fixes for many of these issues, so the first step is making sure you are running the latest version. The most common problem is the taskbar text overlapping with system tray icons or the Windows Widgets button on the left side. Another frequent issue is the “There is an Already Instance Running” error that appears after Windows 11 feature updates because the old process did not terminate cleanly.
- Make sure you are running Traffic Monitor version 1.85.1 or later
- Right-click the floating window and check if “Show taskbar window” is enabled
- Open Options > Taskbar Window Settings and enable “Avoid overlapping with right Widgets”
- If the taskbar display is misaligned, try switching your Windows 11 taskbar alignment from center to left (Settings > Personalization > Taskbar > Taskbar behaviors)
- If you get the “Already Instance Running” error, open Task Manager, find and end all TrafficMonitor processes, then relaunch the application
- As a last resort, delete
config.inifrom the Traffic Monitor folder and restart the app to reset all settings
Pro tip: On Windows 11 23H2 and 24H2, if the taskbar mode still does not work reliably, use the floating window mode instead. Position it in the bottom-right corner of your screen near the taskbar and set the window to “Always on top” for a similar experience without the compatibility headaches.
Check our system requirements for Windows 11 compatibility details.
Traffic Monitor settings are not saving after I close the app – how do I fix this?
Settings not saving in Traffic Monitor is almost always a file permission issue. The application stores its configuration in config.ini inside the same folder as the executable, and if that folder is read-only or restricted, changes cannot be written to disk.
This problem appears most frequently when users extract Traffic Monitor to protected locations like C:Program Files, the Desktop (which can have OneDrive sync restrictions), or directly inside the Downloads folder (which some security policies restrict). The issue also occurs when running the standard version without administrator privileges, because the WinRing0 driver initialization can interfere with the settings save routine if elevation fails partway through.
- Move the Traffic Monitor folder to a location with full write permissions, such as
C:AppsTrafficMonitororD:ToolsTrafficMonitor - Right-click the folder, go to Properties > Security, and ensure your user account has “Full control”
- Run Traffic Monitor once as administrator (right-click > Run as administrator)
- Open Options > General Settings and check “Save to AppData Directory” – this stores config in
%AppData%TrafficMonitorwhere permissions are never an issue - Alternatively, open
global_cfg.iniin the program folder with a text editor and changeportable_mode=truetoportable_mode=false
Pro tip: If your settings keep resetting specifically on startup but save fine during the session, the issue might be that a startup shortcut points to a different copy of Traffic Monitor than the one you are configuring. Search your system for all copies of TrafficMonitor.exe and remove any duplicates.
Our Getting Started guide covers the recommended installation location and initial setup.
How do I update Traffic Monitor to the latest version?
Traffic Monitor does not include a built-in auto-update feature. To update, you download the latest ZIP from the official source and replace your existing files. Your settings and custom skins are preserved as long as you keep your configuration files.
The current latest version is 1.85.1, released on February 10, 2025. Each new release is posted on the GitHub releases page with detailed changelogs describing bug fixes and new features. Because Traffic Monitor is a portable application, updating is straightforward – you replace the executable and related files while keeping your config.ini and any custom skin files you have added.
- Close Traffic Monitor completely – right-click the system tray icon and select “Exit”
- Download the latest version from our download section or the GitHub releases page
- Back up your current
config.iniandglobal_cfg.inifiles (these hold your preferences) - Extract the new ZIP to the same folder, overwriting the old
TrafficMonitor.exeand DLL files - Copy your backed-up config files back into the folder if they were overwritten
- Launch the new version and verify your settings are intact
Pro tip: Bookmark the GitHub releases RSS feed or “Watch” the repository (with release-only notifications) to get notified when new versions come out. Since there is no auto-update, this is the only way to know when updates are available without manually checking.
Visit our download section for the latest release.
What is new in Traffic Monitor version 1.85.1?
Version 1.85.1, released on February 10, 2025, is a maintenance release focused on fixing Windows 11 compatibility issues and improving accuracy of system monitoring readings.
This release addressed several long-standing bugs reported by the community on GitHub. The most significant fix resolved the Windows 11 taskbar display problems that caused the embedded monitor to overlap with system tray icons or the Widgets button. The update also fixed a display error where RAM usage showed incorrect values on systems with more than 100 GB of installed memory, which affected workstation and server users. Network speed accuracy was improved for high-bandwidth connections above 1 Gbps, where previous versions occasionally reported lower-than-actual throughput during large transfers.
- Windows 11 taskbar fix: Resolved overlapping issues with system tray and Widgets on Windows 11 22H2/23H2
- Memory display fix: Corrected RAM usage calculation for systems with more than 100 GB RAM
- Network speed accuracy: Improved monitoring precision on high-speed (1 Gbps+) network connections
- Stability improvements: Fixed occasional crash when switching between network adapters while the taskbar window is active
- Skin rendering: Fixed PNG transparency issues in custom skins on high-DPI displays
Pro tip: After updating to 1.85.1, reset your taskbar window settings if you previously applied workarounds for Windows 11 display issues. The new version handles taskbar positioning natively, so old workaround settings might actually cause new problems.
Download the latest version from our download section.
Traffic Monitor vs Rainmeter – which is better for desktop system monitoring?
Traffic Monitor and Rainmeter serve different purposes. Traffic Monitor is a focused, lightweight tool for real-time network speed, CPU, and RAM display. Rainmeter is a full desktop customization platform that can display system stats among many other things. Choose Traffic Monitor for quick, minimal monitoring; choose Rainmeter for deep desktop personalization.
Traffic Monitor uses under 10 MB of RAM and nearly zero CPU. It launches in seconds and gives you a clean readout of upload speed, download speed, CPU percentage, and RAM usage. Rainmeter is far more powerful but also more complex – it uses 30-80 MB of RAM depending on loaded skins, requires downloading and configuring third-party skins, and has a significant learning curve for customization. Rainmeter can show weather, music players, RSS feeds, calendars, and much more, but for pure system monitoring, it is overkill for most users.
- Setup time: Traffic Monitor works in 30 seconds; Rainmeter takes 30 minutes to configure properly
- Resource usage: Traffic Monitor uses under 10 MB RAM; Rainmeter uses 30-80 MB depending on skins
- Taskbar support: Traffic Monitor embeds directly in the Windows taskbar; Rainmeter cannot
- Customization depth: Rainmeter is almost infinitely customizable; Traffic Monitor offers color themes and skins but within a fixed layout
- Portability: Traffic Monitor is a single-folder portable app; Rainmeter requires proper installation
- Hardware monitoring: Traffic Monitor reads CPU/GPU/disk temperatures (standard version); Rainmeter needs third-party plugins for sensor data
Pro tip: You can run both at the same time without conflicts. Some power users use Traffic Monitor for its taskbar embedding (which Rainmeter cannot do) and Rainmeter for a detailed desktop widget showing disk usage, weather, and other data.
See our features section for a complete list of Traffic Monitor capabilities.
How do I customize Traffic Monitor skins and appearance?
Traffic Monitor supports custom skins using PNG images with transparency, and you can also change individual item colors, fonts, and display order without creating a full skin. The customization options are accessible through the right-click context menu.
The skin system works by loading PNG image files from the skins folder inside the Traffic Monitor directory. Each skin consists of background images for both the floating window and taskbar display modes. You can find community-created skins on the GitHub Discussions page under “Show and Tell,” where users share their custom designs. Beyond skins, you can customize each display item individually – change the color of upload speed text separate from download speed text, pick different fonts, adjust the display order, and toggle individual items on or off.
- Right-click the floating window and select “Other settings” or “Options”
- Go to the “Floating window settings” tab to customize colors, font, and display items for the desktop overlay
- Go to the “Taskbar window settings” tab for the same options in taskbar mode
- To use a custom skin, download a skin pack and extract it into the
skinssubfolder - Right-click the floating window, hover over “Skin,” and select from available skin options
- Enable “Auto light/dark mode” in settings to switch skins automatically based on your Windows theme
Pro tip: You can create your own skin by making a PNG image with transparent regions where the stats text will be displayed. The file should be named background.png for the floating window and placed in a new subfolder inside the skins directory. Use the existing default skin files as a template for dimensions and text positioning.
Learn about all customization features on our features page.
How do I enable CPU and GPU temperature monitoring in Traffic Monitor?
CPU and GPU temperature monitoring is available only in the standard version of Traffic Monitor and requires running the application with administrator privileges. The Lite version does not support hardware temperature readings.
Temperature monitoring works through the LibreHardwareMonitor library, which is bundled with the standard version. This library accesses hardware sensors via the WinRing0 kernel driver, which is why admin rights are required. The standard version can display temperatures for the CPU, GPU, hard drives, and motherboard chipset. GPU temperature works with both NVIDIA and AMD graphics cards. The readings refresh every second by default and are accurate to within 1-2 degrees Celsius compared to dedicated tools like HWiNFO64.
- Make sure you have the standard version of Traffic Monitor (not Lite)
- Right-click
TrafficMonitor.exeand select “Run as administrator” (or set it to always run elevated in Properties > Compatibility) - Right-click the floating window, go to “Other settings” or “Options”
- Navigate to the “General Settings” tab and look for “Hardware monitoring”
- Check the boxes for the sensor readings you want: CPU temperature, GPU temperature, disk temperature, motherboard temperature
- The new readings will appear in both the floating window and taskbar display (if enabled)
Pro tip: If enabling hardware monitoring causes high CPU usage or application crashes, the LibreHardwareMonitor DLL may be incompatible with your specific hardware. You can try updating LibreHardwareMonitorLib.dll by downloading the latest version from the LibreHardwareMonitor GitHub repository and replacing the file in the Traffic Monitor folder. If problems continue, disable hardware monitoring and use the Lite version instead.
Check the system requirements to verify your setup supports hardware monitoring.
Can Traffic Monitor track daily and weekly network usage history?
Yes, Traffic Monitor includes a built-in traffic statistics feature that tracks your daily and monthly network usage. This is useful for users on metered connections or anyone who wants to monitor how much data their computer transfers over time.
The traffic history feature logs total upload and download bytes for each day. You can view this data through the right-click menu by selecting “Traffic Statistics” or “Network Traffic History.” The display shows a table with dates, upload totals, download totals, and combined totals for each day. Monthly summaries are also calculated automatically. The data is stored locally in a file within the Traffic Monitor directory and is not sent anywhere externally. Note that the history tracks traffic through the currently selected network adapter only, so if you switch between Wi-Fi and Ethernet, each adapter’s usage is counted separately.
- Access the history through Right-click > Traffic Statistics
- Data is stored per network adapter, not combined across all connections
- History data persists across application restarts and system reboots
- You can reset the statistics counter from the same dialog if needed
- Traffic Monitor does not currently support setting data usage alerts or caps based on the history
Pro tip: If you want Traffic Monitor to track all traffic regardless of which adapter is active, set it to “Auto select” in the network adapter settings. The history will still log per-adapter, but the live display will always show whichever connection is currently in use, and each adapter’s history will be recorded independently.
Learn more about monitoring features on our features page.
Have more questions? Check our Getting Started guide or visit the official GitHub repository for community support.